Written by Bobbi J. Carothers, PhD, statistical data analyst III at the Brown School; Amar Dhand, MD, DPhil, adjunct assistant in the Department of Neurology at the School of Medicine; and Douglas Luke, PhD, Irving Louis Horowitz Professor in Social Policy at the Brown School
Networks are ubiquitous. They are complex systems that we can see almost everywhere we look: whether it is how proteins interact, how the brain is structured, how friendships are formed, business use of organizational connections, coalitions organizing themselves to enact new policies, or how transportation and telecommunication infrastructures are organized.
Networks play an important role on multiple fronts in public health, including disease transmission, social support systems, spread of new ideas, and policy/advocacy coalitions. Network science has emerged as a new discipline that focuses on answering important scientific questions through a network and complex systems lens.
Network analysis is one of our specialties at the Center for Public Health Systems Science, here at Washington University’s Brown School. We use network analysis tools in several of our public health policy research and evaluation projects. In recent years, we have used network approaches to study diffusion of evidence-based public health guidelines, map the structure of state tobacco control programs, model the relationship of mentoring and scientific collaboration among implementation science scholars, identify gaps in national public health coalitions, and explore the relational structure of scientific teams.
Here are three detailed examples of the type of network analysis work happening here at Washington University:
Mapping growth of cross-disciplinary collaboration at Washington University
At the Center for Public Health Systems Science, we are working on a large project evaluating the Institute of Clinical and Translational Sciences (ICTS) at the Washington University School of Medicine. A major goal of ICTS is to promote cross-disciplinary research to facilitate the translation of science “from bench to bedside.” Using specialized analysis techniques with grant submission data, we have been able to track not only the growth in scientific collaboration since ICTS funding began in late 2007, but also the increase in the cross-disciplinary nature of those collaborations (Luke et al. 2015).
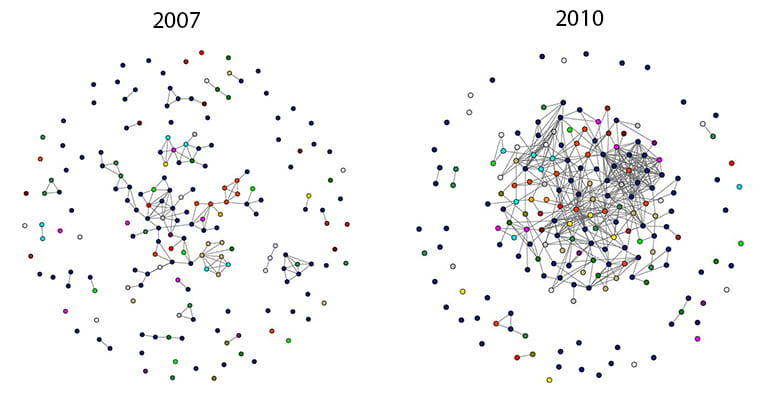
When comparing collaboration on grant submissions from just before ICTS funding in 2007 and a few years into funding in 2010, it’s easy to see the increase in partnerships as indicated by the proliferation of links among members who joined ICTS in its first year (Figure 1). Indeed, the average number of partnerships per member went from 1.65 in 2007 to 4.41 in 2010. What’s harder to see from the picture is the growth in cross-discipline ties relative to within-discipline ties. Modularity is one measure of mixing between groups in networks – the higher the modularity, the more members connect only to others from the same group. In this case, modularity went down by 61% from 2007 to 2010, meaning that members were more likely to collaborate with others from different disciplines as time went on.
These findings are exciting because they demonstrate the return on investment in large-scale research initiatives such as ICTS.
After our initial descriptive investigations of the ICTS networks, we were able to statistically model these patterns and confirm the role of scientific discipline (Dhand, et al. 2016) with a network technique known as exponential random graph modeling (ERGM). ERGM can be interpreted as logistic regression that predicts network ties and accounts for the non-independence of network data (Goodreau, 2007). When examining relative predictive probabilities for grant collaboration, we generally found increases for cross-disciplinary collaboration. For example, the probability of a link between an Allied Health scientist and a Social Scientist went from less than .05% to more than .10% (holding several other characteristics constant). On the other hand, the probability of a link between two Social Scientists decreased from .25% to less than .10%. These findings are exciting because they demonstrate the return on investment in large-scale research initiatives such as ICTS.
Developing interactive network analysis tools to enhance evaluation
In addition to specialized analysis techniques, network analysis requires specialized visualization tools. Over the course of the Center’s 16-year history of program and policy evaluation, we have used innovative ways to present our evaluation findings in order to engage stakeholders. Network analysis serves as a map for partners so they can see important aspects of their communication patterns (e.g., Luke et al 2013, Moreland-Russell & Carothers, 2015). For small networks, a static graphic with labeled nodes is usually sufficient.
However, very large networks can be difficult to interpret because of the challenges of labeling nodes, as shown in Figure 2. In this case, we mapped a network of 612 organizations as part of an evaluation for ReThink Health to examine health system stewardship and sustainable financing (Carothers, et al. 2015). While the static graphic was useful for pointing out the identities of the central organizations, very little could be done to interpret the graphic without being able to see the identification of the smaller nodes.
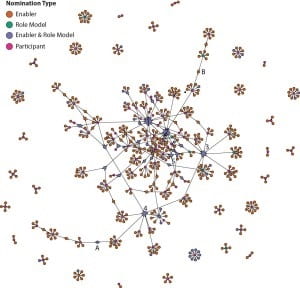
Project stakeholders often have a greater familiarity with the members of their networks than an external evaluator does, so they may want to explore the data in a different way. This tool allows them to engage directly with the network structure, search for and click on organizations, and explore the underlying structure of the organizational relationships. This way, network analysis approaches are useful tools for public health research and evaluation.
Creating art from personal networks of stroke survivors
While the visualization of large networks can be challenging, the examination of small networks has its own challenges and opportunities. Our colleague Amar Dhand, a neurologist at the Washington University School of Medicine, takes a unique approach to network analysis.
Unlike most neurologists, who approach networks at the level of neuron connections, Amar studies the personal social networks of stroke survivors. Also known as “ego networks,” these networks are focused on a single person (the ego), the people he/she is connected to (the alters), as well as the connections among the alters. Amar’s research examines how a person’s personal network changes during stroke recovery and how those network changes are related to the quality of his/her recovery. Early in the research, he took the most basic approach to visualizing the networks of his participants: drawing them on Post-It notes and sticking them to the wall of his office (Figure 3a).
One of his participants took one look and knew she could do better. Lindsay Obermeyer, a professional textile artist, began crocheting the networks as mandalas (Figure 3b). Thus, the Social Networks and Stroke Recovery Crochet Project was born, where actual data from actual participants are turned into art. You can see for yourself how the data are literally woven into the fabric of the community by visiting the exhibit currently on display (until May 20th) in the lobby of the Center for Advanced Medicine at Washington University’s School of Medicine.
Network Science Interest Group
Washington University has seen incredible growth in the interest and use of network science theories and approaches in the last several years. Important network projects are being done in public health, social work, political science, medicine, neurology, law, and business.
Recognizing this growth, we formed the Network Science Interest Group (NSIG) in the Fall of 2015. NSIG is a community of scholars, researchers, and evaluators at WU who are interested in network science. Our mission is to share ideas, provide resources for the broader community, and enhance the network of network scientists. We meet once a month on Danforth Campus to discuss current network research, learn about new tools, and… network!
Check out our website and come join us for a meeting.
References
Carothers, B.J., Sorg, A.A., Luke, D.A., Milstein, B. (2015). ReThink Health Frontiers in Sustainable Financing for Health System Stewardship Baseline Network Assessments: Phase I Networks. St. Louis, MO: Washington University in St. Louis.
Dhand, A., Luke, D.A., Carothers, B.J., Evanoff, B.A. (2016). Academic cross-pollination: The role of disciplinary affiliation in research collaboration. PLOSOne, 11.
Goodreau, S.M. (2007). Advances in exponential random graph (p*) models applied to a large social network. Social Networks, 29, 231-248.
Luke, D.A., Carothers, B.J., Dhand, A., Bell, R.A., Moreland-Russell, S., Sarli, C., & Evanoff, B.A. (2015). Breaking down silos: Mapping growth of cross-disciplinary collaboration in a translational science initiative. Clinical and Translational Science, 8, 143-149.
Luke, D.A., Wald, L.M., Carothers, B.J., Bach, L.E., & Harris, J.K. (2013). Network influences on dissemination of evidence-based guidelines in state tobacco control programs. Health Education and Behavior, 40(IS), 33S-42S.
Moreland-Russell, S., & Carothers, B.J. (2015). An examination of two policy networks involved in advancing smokefree policy initiatives. International Journal of Environmental Research and Public Health, 12, 11117-11131.