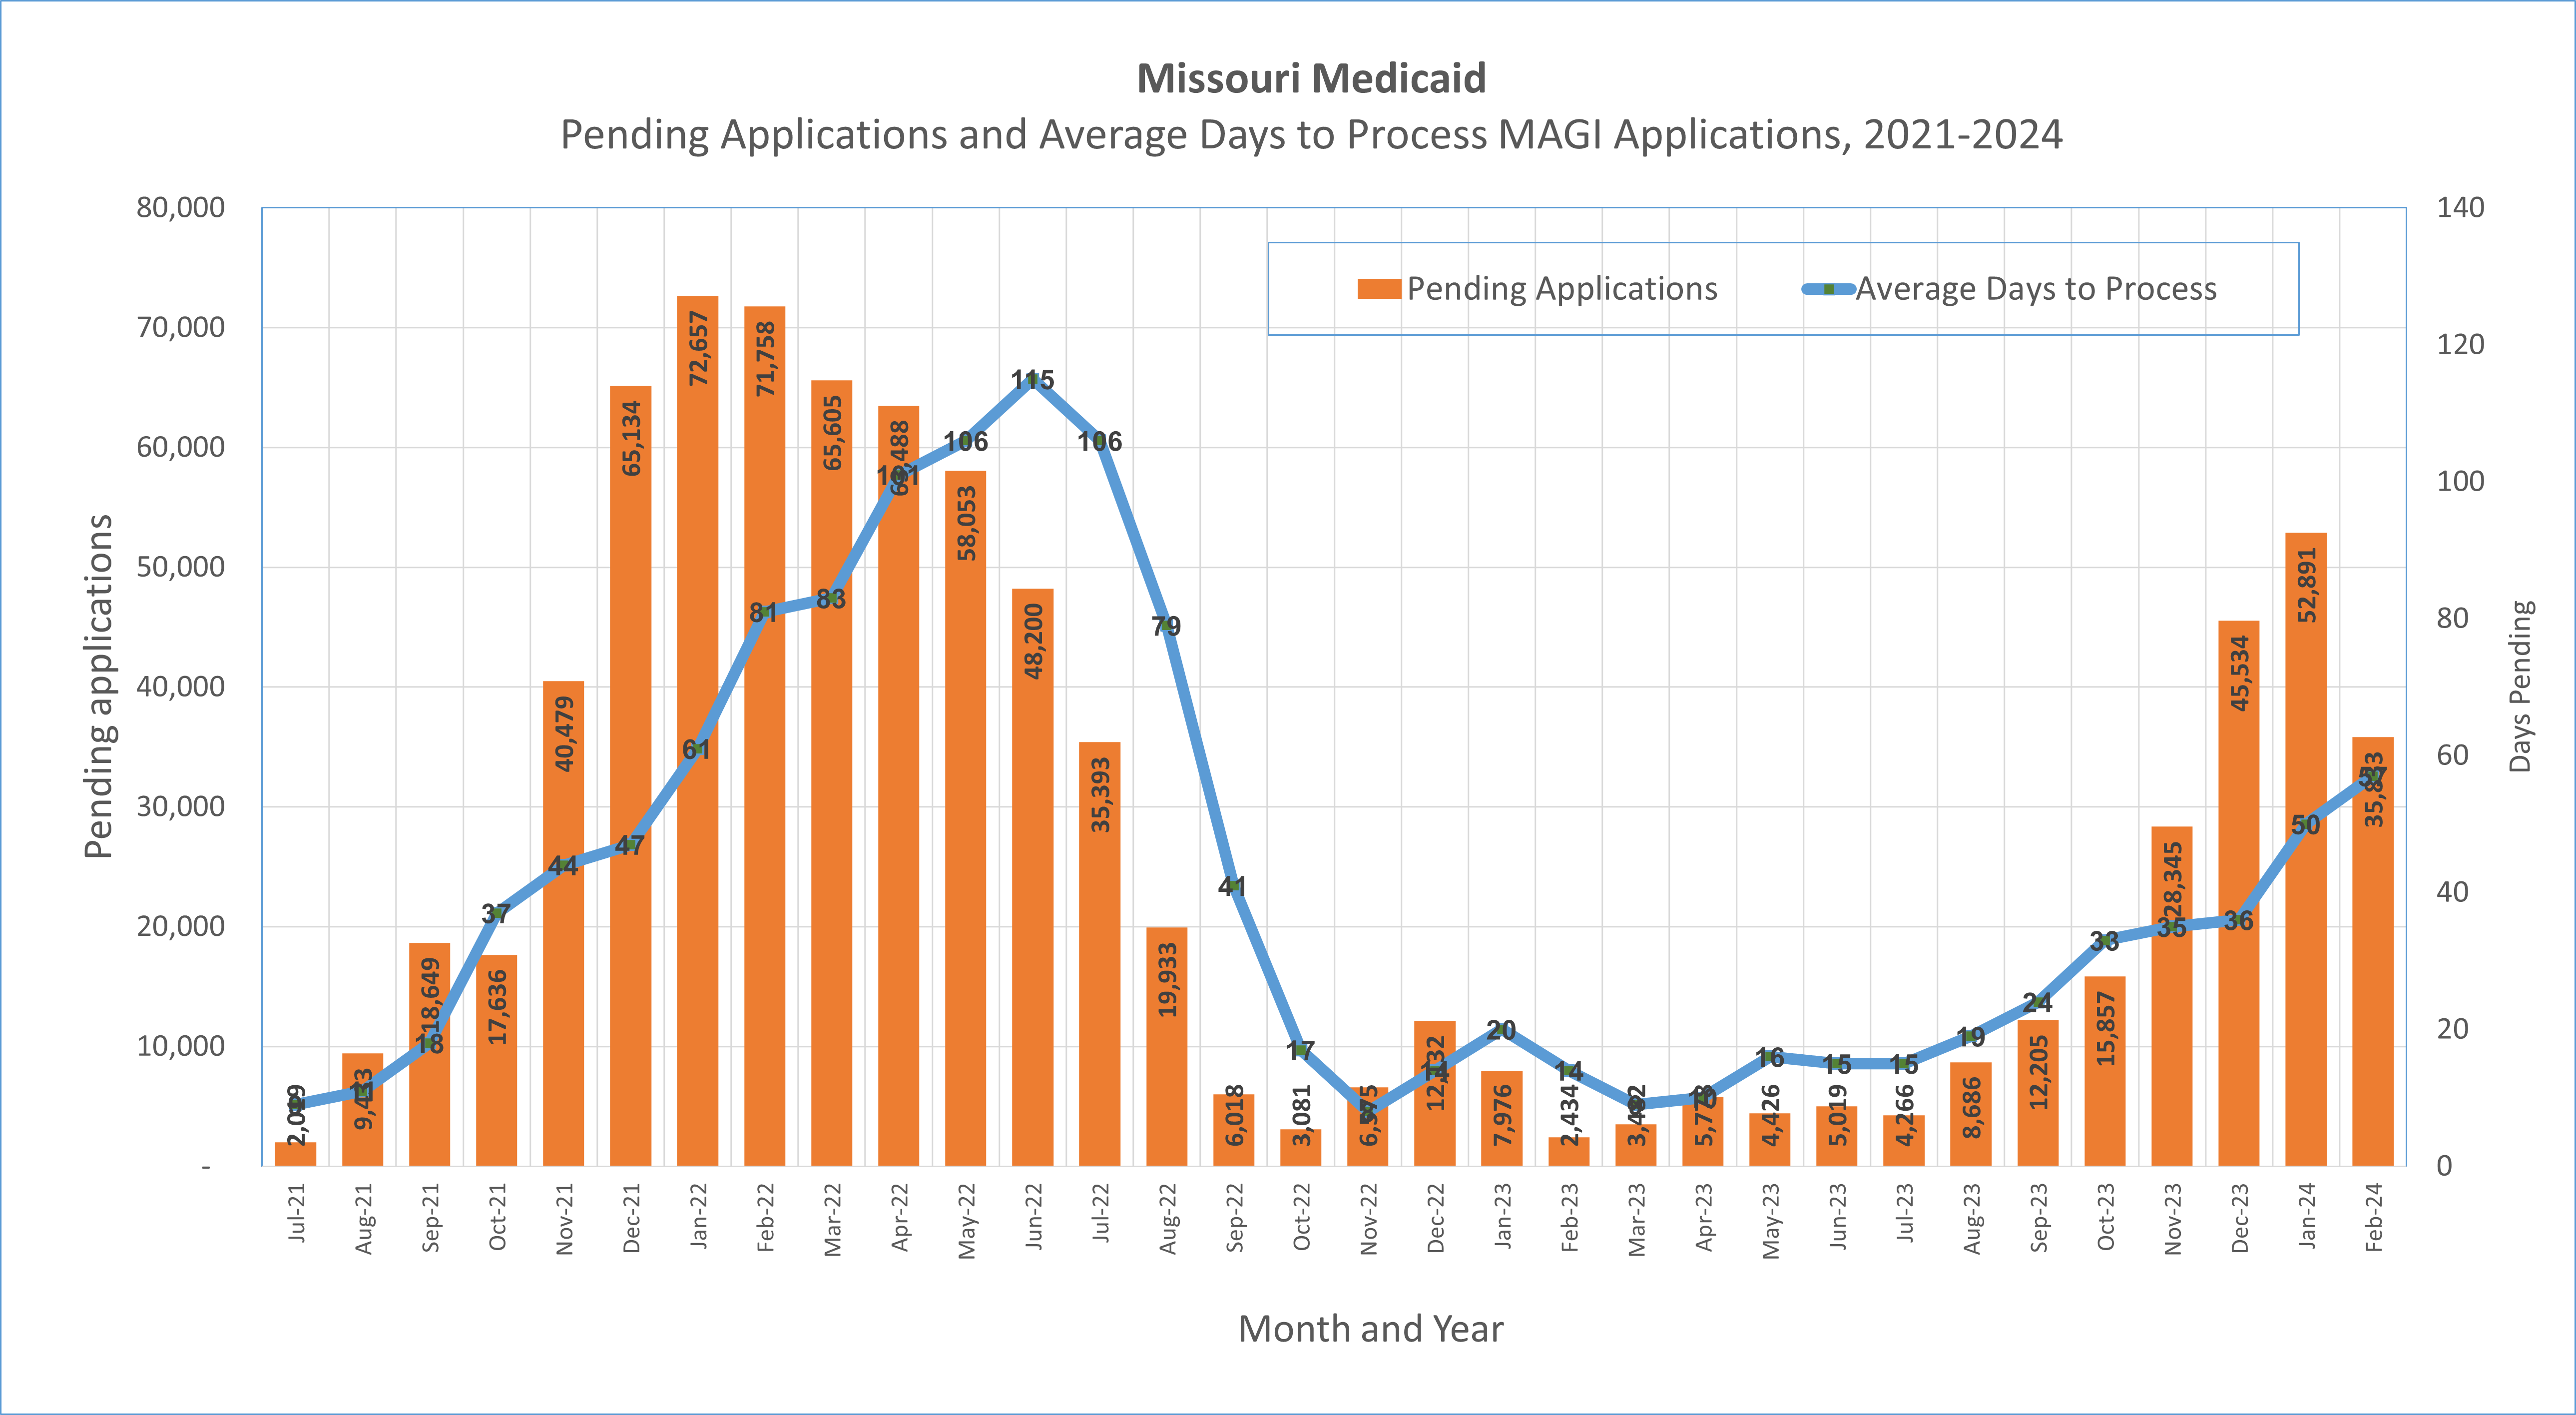
Almost 36,000 applications remain pending, for an average for 57 days
Written Timothy McBride, co-director of the Center for Advancing Health Services, Policy and Economics Research
March 2024 (updates based on February 2024 data).
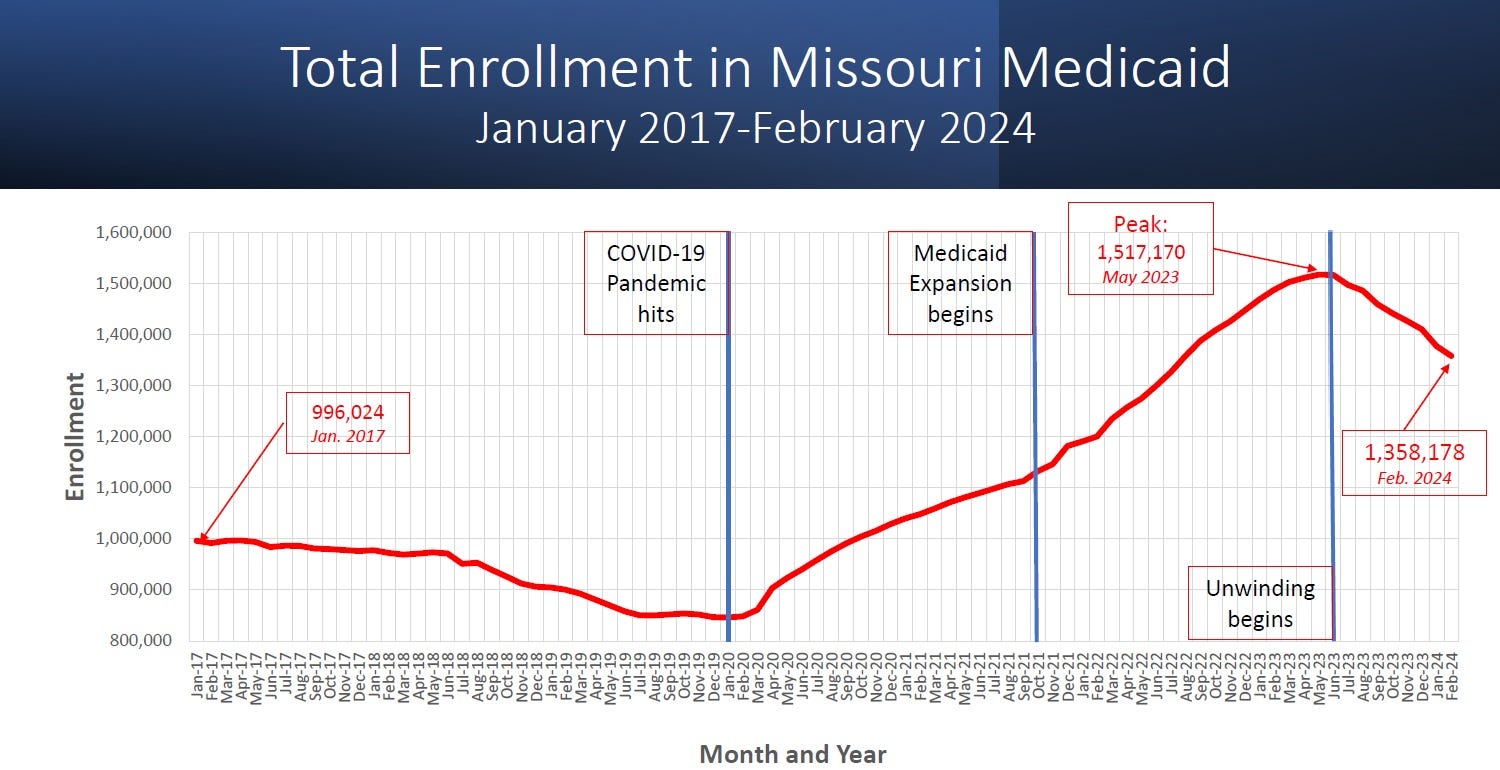
As the process of unwinding continues, total enrollment in Missouri’s Medicaid program continues to drop to 1,358,178 down 158,513 (down -10.5%) from the enrollment level in June 2023 when the unwinding started (1,516,691). In addition, the state’s Medicaid agency received a large number of applications (97,541) during the Obamacare open enrollment period (November 2023 to January 2024). For various reasons, the state has had difficulty processing these applications in a timely basis, so that at the end of February over 35,833 applications were still pending, and the average wait time to process these applications was 57 days (longer than the legally allowed 45 days to process applications). These findings are based on analysis of state of Missouri Family Support Division data, reflected in the Monthly Management Report, and posted on their website.
Factors affecting enrollment. Medicaid expansion began in Missouri in 2021. During the Public Health Emergency (PHE) annual reverifications of Medicaid enrollment were paused by the federal government, which meant that those enrolled in Medicaid during that period were not disenrolled. Nationwide Medicaid enrollment rose to a record high during the pandemic, and in Missouri the enrollment also rose to over 1.5 million, a record. Federal law passed at the end of 2022 called for an end to the PHE, and a renewal of the recertification process, commonly called the “unwinding” of the pandemic as it is affecting Medicaid. The process of recertifying enrollment in Medicaid began again in June 2023, which generally had been done on an annual basis before the COVID pandemic. In the meantime, Missouri residents continue to enroll in Medicaid through the expansion, or through other categories, or re-enrolled after losing their coverage (called churning).
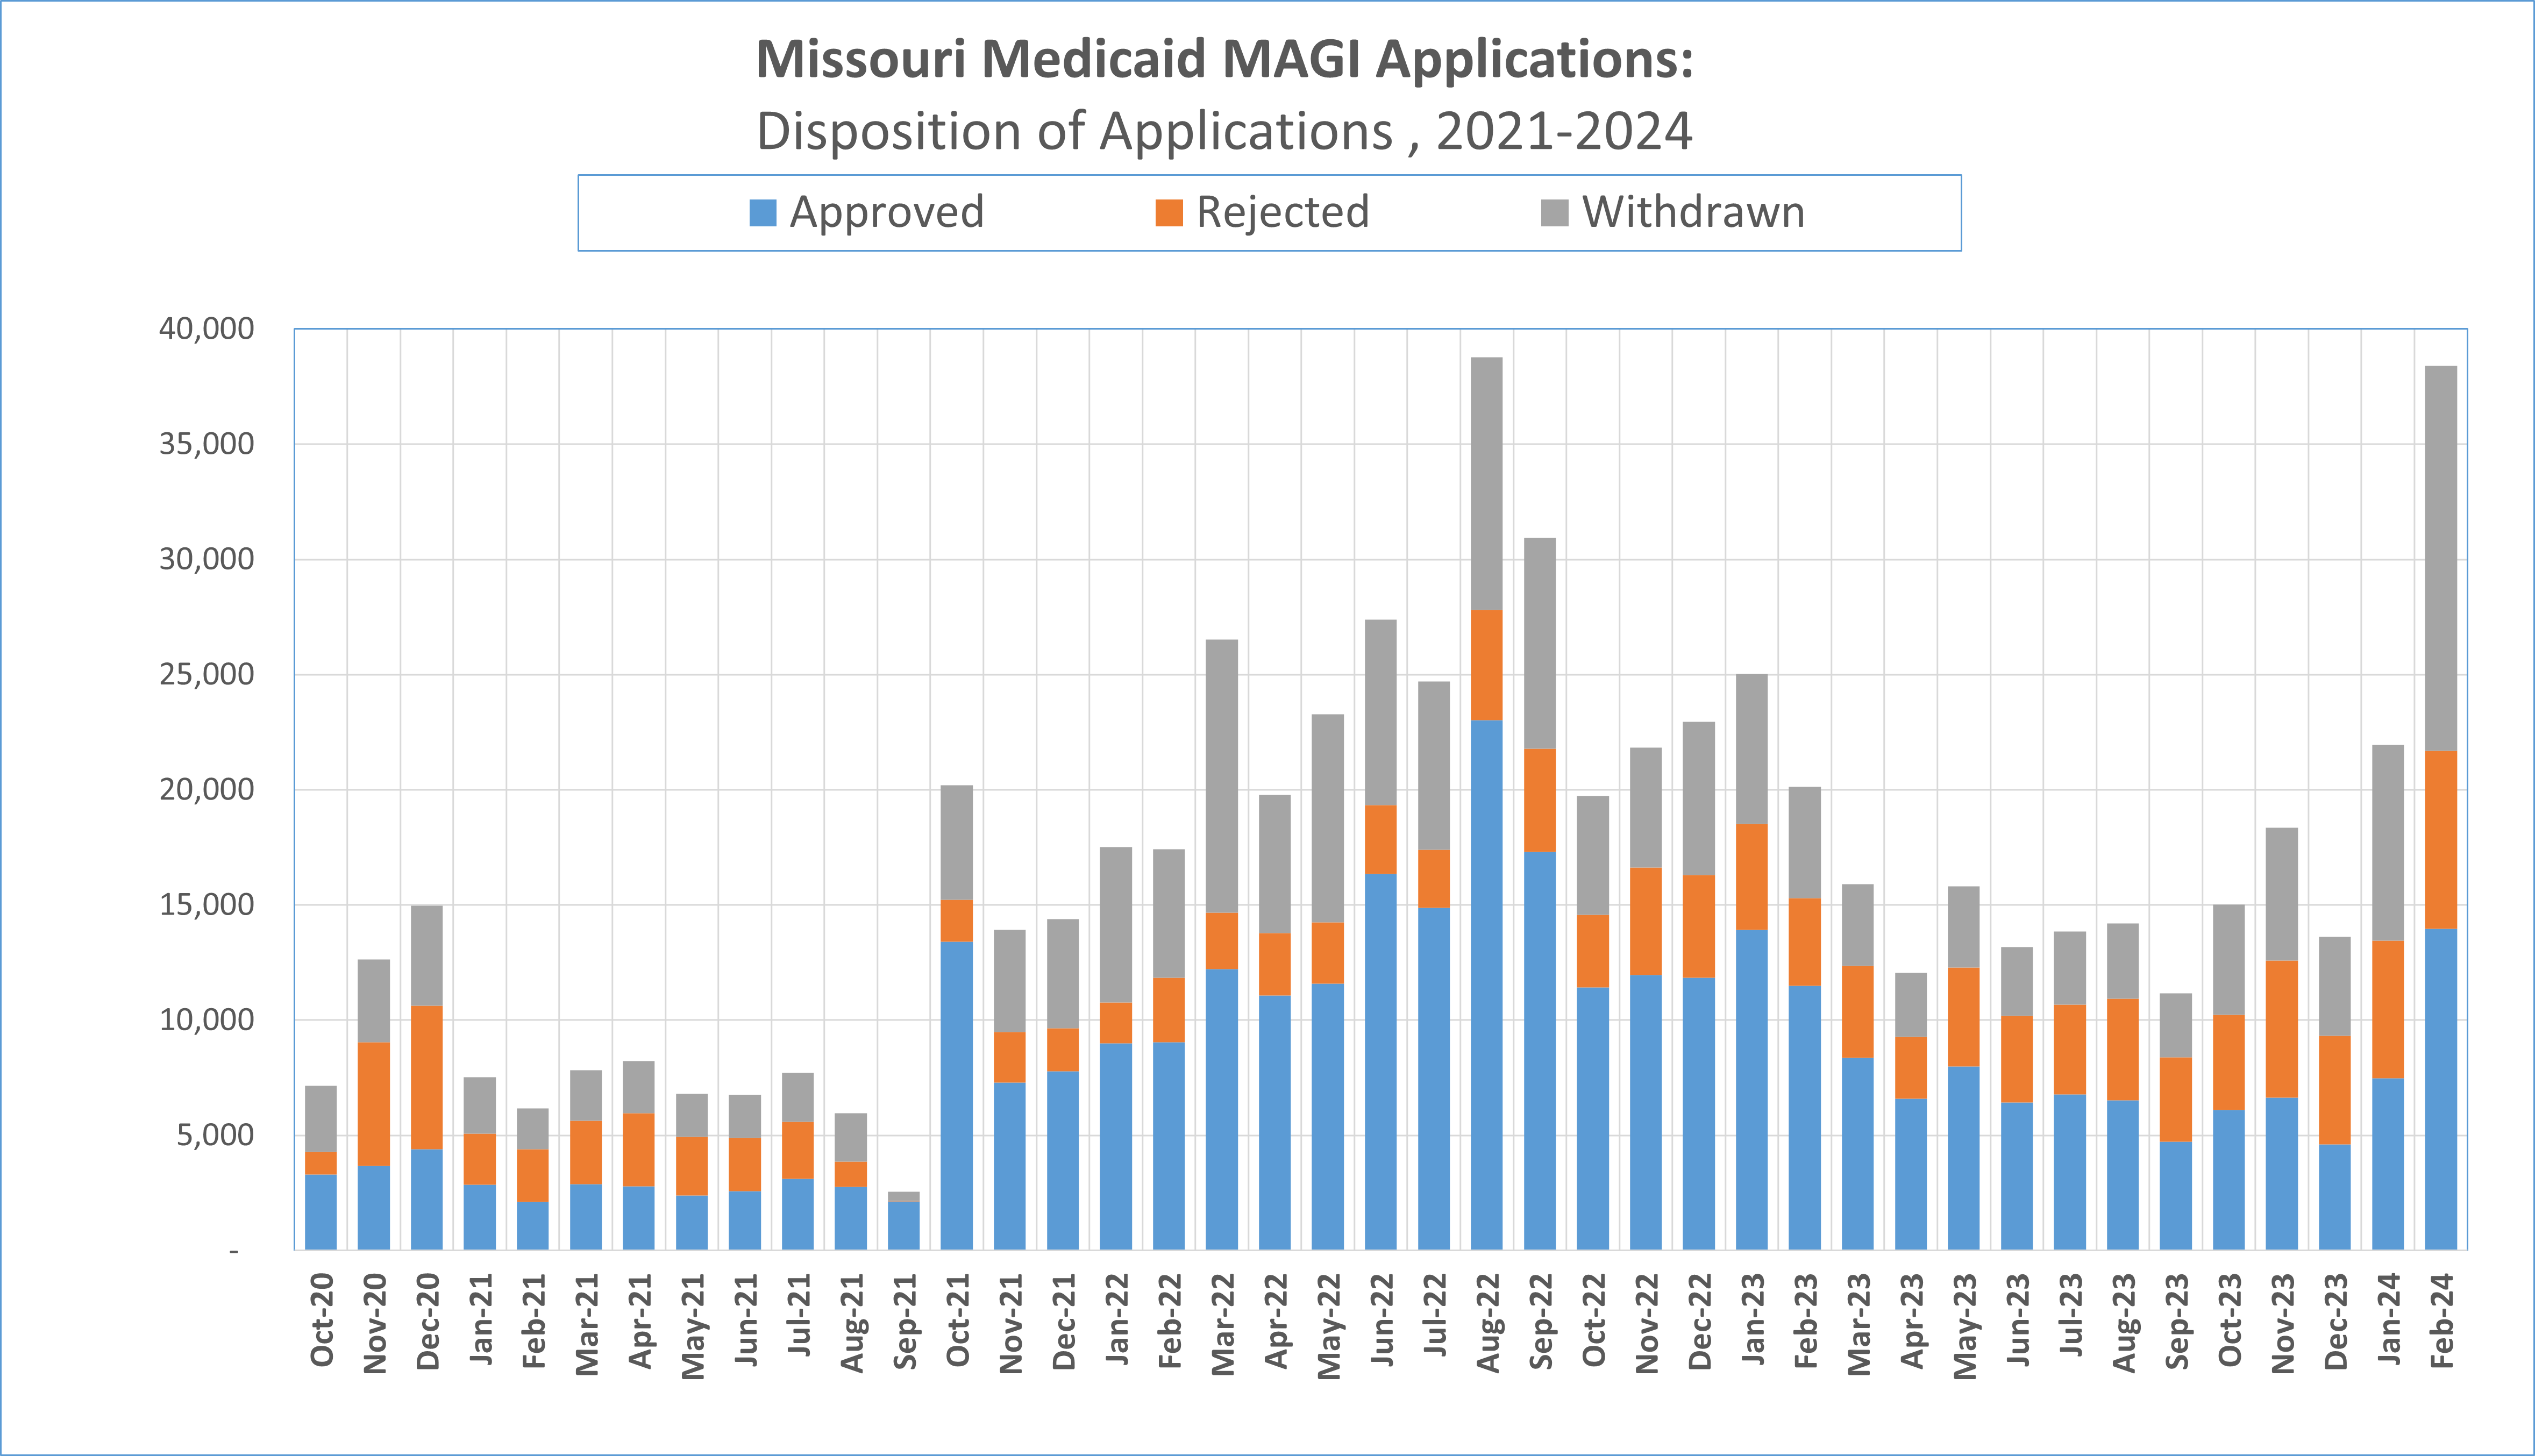
Applications. As shown in the figure, 21,349 MAGI applications were received in February 2024. Though this was significantly below the number received in January 2024, this reflects the end of the Obamacare (marketplaces) open enrollment period, when people who may start applying for a marketplace plan may end up applying for Medicaid. The state is still receiving about 700 applications per day in February 2024, though this is higher than the average of roughly 500 per day received prior to the unwinding. This may suggest that some people are re-applying to Medicaid, a process called “churning”.

Pending applications and Average days to process applications. In February 2024, a large number of applications remained pending (35,833), though this was a significant drop from the number pending in January 2024 (52,891) (see graph). It is still taking a long time to process applications (57 days on average), longer than the number of days legally allowed to process applications for Medicaid. In February the number of days to process MAGI applications increased, compared to January 2024 (50 days). It is worth noting that this average reflects that some people are waiting longer than the average, some not as long. It is worth noting that 12,400 “non-MAGI” applications remain pending at the end of February as well (non-MAGI applications are mostly comprised of people with disabilities), and the average number of days it is taking to process these applications is 72 days. Putting together the total number of applications pending this means that over 48,000 applications are pending.
One factor that seems to have contributed to many applications being processed in February 2024 was that an increased number of applications were “withdrawn” (16,712), more than twice the average number of applications typically withdrawn (see chart). This may reflect Obamacare marketplace applications that were withdrawn. However, nearly twice as many applications were approved in January, compared to February.
Total net enrollment. Net enrollment in Missouri’s Medicaid program has dropped to 1.36 million in February 2024, down -10.5% from from the peak enrollment hit right as the unwinding began in June 2024 (1.52 million).
Who is losing coverage? Looking at the drop in enrollment of 158,513 since the unwinding began, over half (54%) of the enrollees losing coverage are children (-86,010) (see graph). This is in part because children are a large share of the enrollees in Medicaid, but on the other hand, the eligibility level of children for Medicaid is quite high (up to 300% of the federal poverty level), so it remains perplexing why so many children are losing coverage. In looking at the other categories, roughly 14% each of those losing coverage has fallen into the categories of adult expansion (-22,795), people with disabilities (-21,664) and custodial parents (-21,393). It is notable that one category of recipients has grown in recent months — the women’s health services program, which has grown about 44% (not shown on graph).

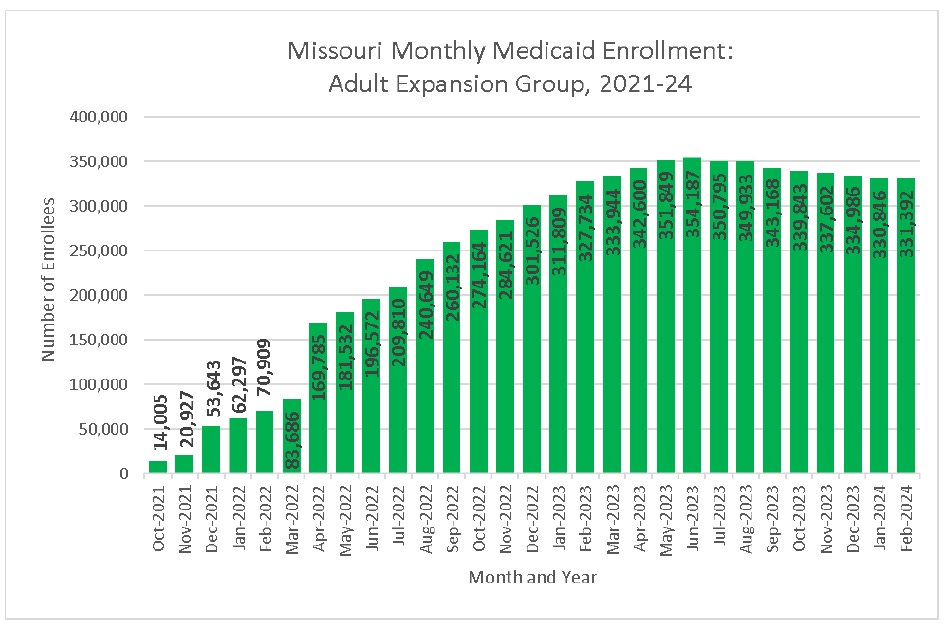
Update on Medicaid expansion. As noted, the expansion of Medicaid began in Missouri in July 2021, with the first people enrolled in October 2021. As shown the graph, the current enrollment in the Adult Expansion Group (AEG) is 331,392 in February 2024, a slight increase relative to January 2024.