State and Federal Shares of Medicaid Costs Prior to Expansion, 2013
Medicaid Federal Matching Assistance Percentages in Expansion and Non-Expansion States
Prior to 2014, the main factor determining how much federal funding states received for their Medicaid programs was the Federal Medicaid Assistance Percentage (FMAP). Beginning in 2014, states that adopted Medicaid expansion received a higher match rate (100% for three years, tapering off to 90%) for their newly eligible populations only. There is also an enhanced FMAP which applies to children in the CHIP program. However, the baseline FMAP is still extremely relevant.
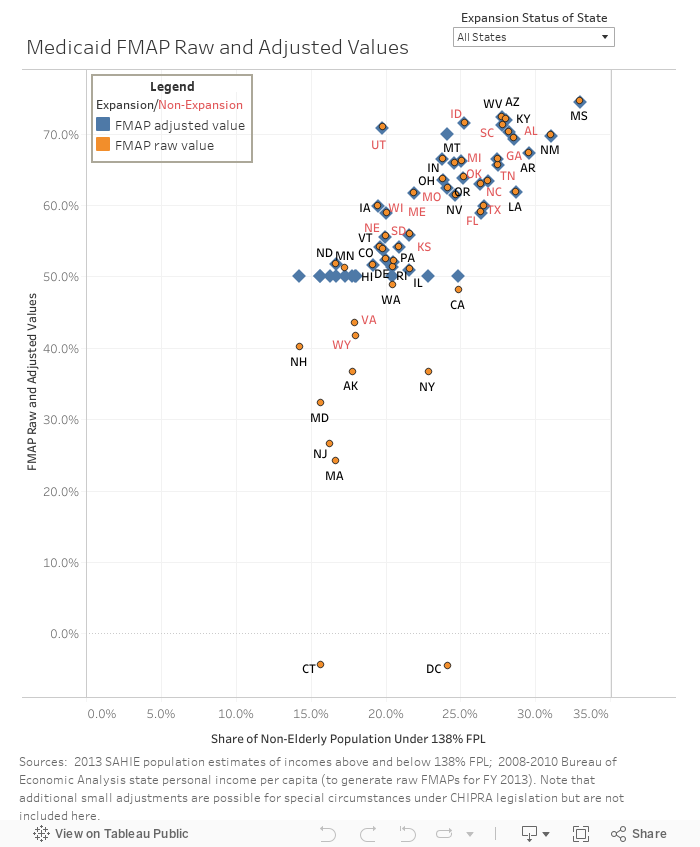
The FMAP formula takes into account each state’s per capita income relative to the U.S. per capita income, with poorer states receiving a higher percentage. There is also a minimum FMAP of 50%, which in fifteen states actually overrides the value based on the per capita income formula.
From a state budget perspective, it is useful to think about the burden of covering the population with incomes below 138% of the Federal Poverty Level by calculating the share that this population represents out of the state’s total population, because this share is a proxy for the tax base upon which the state might draw in order to fund such coverage. The data visualization below plots this share of the population against the standard FMAP, allowing the user to filter for Medicaid expansion status. Interestingly, all but two if the fifteen states with matching rates boosted to 50% have expanded Medicaid, while a majority of the states whose match rate is not augmented have not expanded.
In the context of proposals to reform Medicaid funding via block grants to states, it is important to be aware of this history when creating new formulas to determine federal shares of funding.